
A decade of immense growth in global egg production
In December 2022, the FAO published data on global livestock production and trade in livestock products, registering a 31.9% growth in egg production in the last 10 years. Poultry World analyses the patterns of global egg production and egg trade at continental and country levels at the beginning of the current decade.
Between 2011 and 2021, global egg production increased by almost 21 million tonnes and reached a volume of 86.4 million tonnes, a 31.9% growth. Asia contributed 73.8% to the absolute increase, and Europe only 2.5%. The regional concentration at country level was very high. In 2021, the 10 leading countries accounted for 77.1% of world egg production, with China alone accounting for 33.9%. The rapid growth in India and Indonesia is noteworthy. No European country was left in the top group.
European and Asian countries dominated egg trade. However, the regional concentration in exports and imports was lower than in production. In 2021, the Netherlands and Turkey were in the top 2 positions, accounting for 26.7% of world exports. For imports, Germany and the Netherlands ranked first and second, together accounting for 27.2% of the world import volume.
Remarkable growth
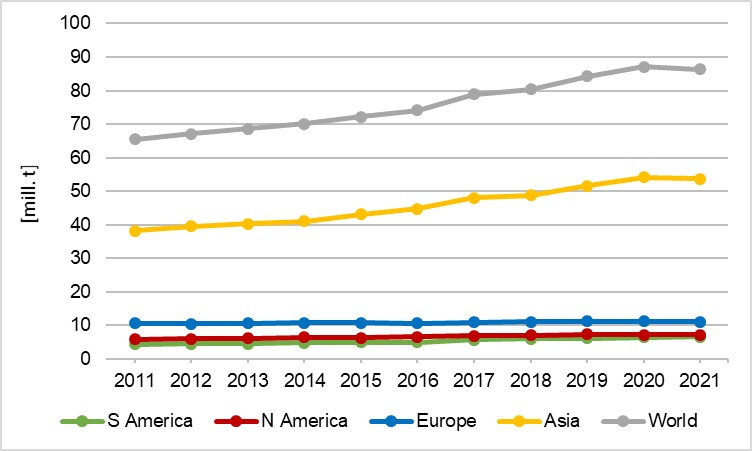
Between 2011 and 2021, world egg production increased from 65.5 million tonnes to 86.4 million tonnes, or by 31.9% (Table 1). In 2021, the continuous upward trend was interrupted by the Covid-19 pandemic and outbreaks of avian influenza in several countries (Figure 1). This trend continued in 2022, when severe avian influenza epidemics were reported not only in Europe and North America, but also in other regions of the world.
Asian countries dominated global egg production
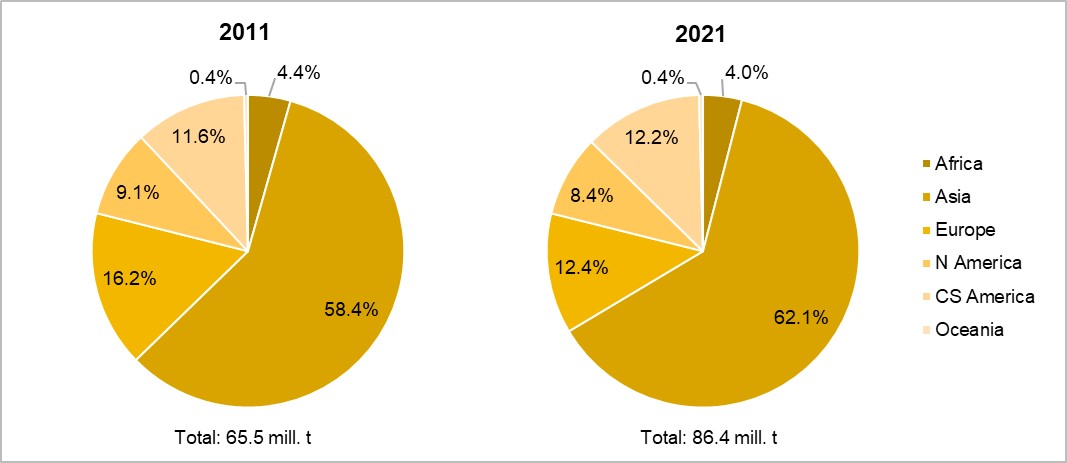
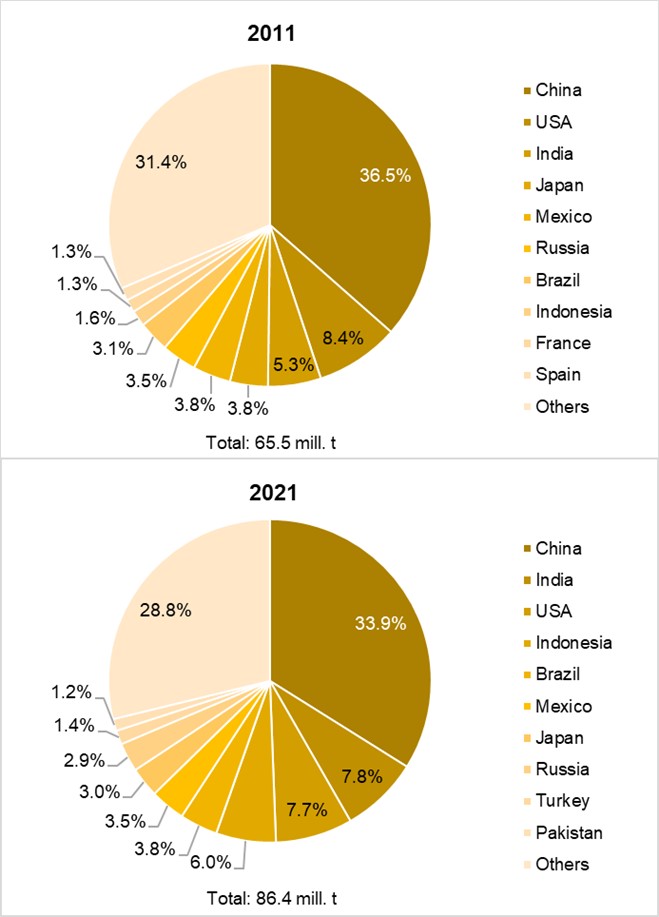
Figure 2 documents the changes in the continents’ shares in global egg production between 2011 and 2021. With the exception of Asia and Central and South America, all continents lost shares, with Europe at 3.3% and North America at 0.7%. These dynamics reflect the absolute and relative changes in production volume over the decade under consideration. With a relative growth of only 4.9%, Europe lagged far behind all other continents. The already high per capita consumption, a declining population and the impact of avian influenza epidemics were the main reasons for the comparatively low growth rate.
Asia contributed 73.8%, Central and South America 14.1%, North America 6.2% and Europe only 2.5% to the absolute growth in global egg production of 20.9 million tonnes.
The observed regional concentration in egg production over the past decades also continued in the second decade of 2021. The share of the 10 leading countries in global production volumes increased from 68.4% in 2011 to 71.2% in 2021 (Figure 3).
A closer look at the dynamics at country level shows not only the changed composition of the countries, but also their ranking (Table 2). In 2021, no European country was in the top group any more. Turkey and Pakistan replaced EU member states France and Spain, and India replaced the USA in second place. Japan fell from fourth to seventh place, Russia from sixth to eighth; Brazil, on the other hand, improved by 2 ranks.
Although China had the highest absolute growth in the decade studied, the increase in production volumes of India and Indonesia is remarkable. China contributed 5.1 million tonnes or 24.6% to global growth, Indonesia 4.1 million tonnes or 19.7% and India 3.2 million tonnes or 15.5%. Population growth and rising per capita consumption, especially in Indonesia and India, due to the increasing per capita income of the growing middle class, were the main factors behind this remarkable momentum.
Europe and Asia dominate global egg trade
Compared to meat, the share of traded table eggs in egg production was very low. In 2021, only about 2.5% of the eggs produced were traded, even 0.3% less than in 2011. The low trade volume is due to the fact that shell eggs cannot be frozen and have a comparatively short shelf life. Table eggs are produced almost exclusively for the domestic market.
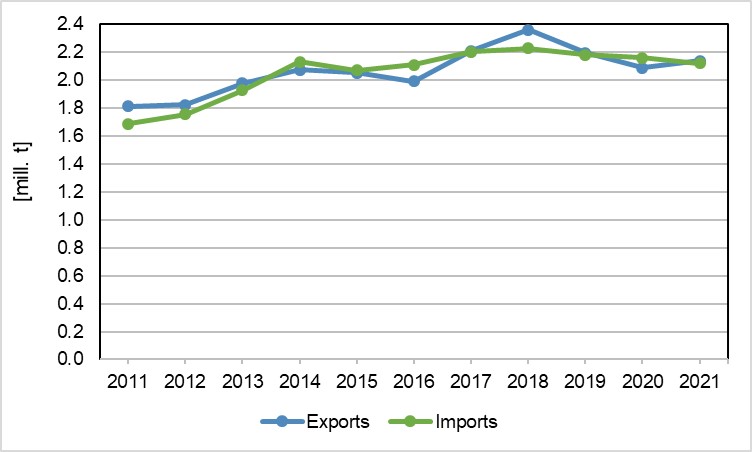
Figure 4 shows the development of global exports and imports of eggs between 2011 and 2021. In the decade under consideration, the export volume increased by 328,000 tonnes, or 18.1%. A closer look at the graph shows that it was not a continuous upward trend. In 2015 and 2016, and again in 2019 and 2020, export volumes declined. In 2015 and 2016, this was a result of massive outbreaks of the avian influenza virus in Europe and North America; in 2019 and 2020, the onset of the covid-19 pandemic and numerous new avian influenza outbreaks caused the decline (Böckmann 2021, Windhorst 2016, 2022).
Global egg imports increased faster than exports. In the period studied, the volume increased by 434,000 tonnes, or 25.7%. The fluctuation was similar to that of egg exports.
Europe and Asia dominated both exports and imports of eggs. In 2011, Europe accounted for 61.8% of the global export volume, followed by Asia with 30.6%. In the following 10 years, Europe lost 7.1% of its former share, while Asia gained 3.3%. In terms of egg imports, Europe’s share fell from 58.7% to 53.2% during the decade under review, while Asia’s share increased from 33.8% to 37%. A detailed analysis of the dynamics at country level will document which countries were able to consolidate their position or were confronted with a loss of market share. In 2021, only North America (+167,000 tonnes) and Europe (+40,000 tonnes) recorded an export surplus, while all other continents had a negative trade balance.
High regional concentration in egg exports and imports at country level
Table 3 and Table 4 document the 10 leading countries in exports and imports of eggs in 2011 and 2021. Figure 5 and Figure 6 show the shares of the ten leading countries in global export and import volumes respectively. Both the tables and the figures show the still high regional concentration in the global egg trade, even if it has decreased in the decade under review.
The Netherlands has been the undisputed leading export country for eggs for decades. However, Table 3 and Figure 5 show that its export volume fell by 30,000 tonnes between 2011 and 2021, and its share in global exports declined by 4.7%. Of the top 10 countries, only 4 (Uzbekistan, the US, Belgium and Spain) gained shares. The rapid growth of Uzbekistan’s and the USA’s exports is remarkable.
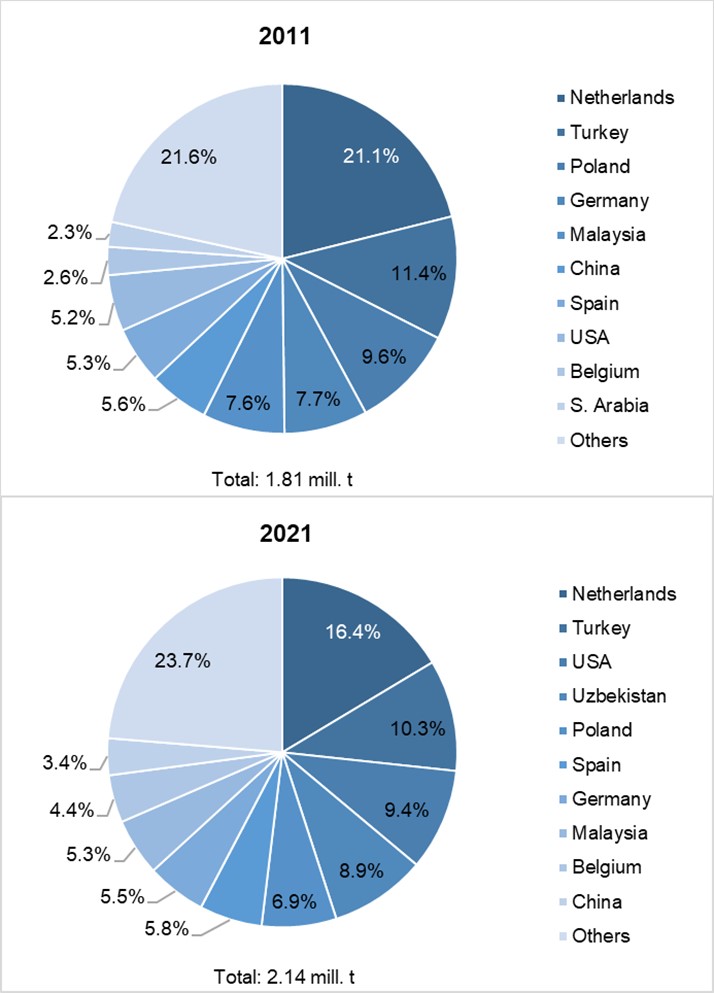
A comparison of the composition and ranking of the countries shows considerable changes. While the Netherlands and Turkey were able to consolidate their top positions, Poland, Germany, Malaysia and China were unable to maintain their previous positions. Uzbekistan replaced Saudi Arabia and was in fourth place in 2021, the USA even made up 5 ranks.
Similar to the Netherlands in egg exports, Germany has been the leading egg-importing country for decades. Close bilateral trade has developed between the 2 countries, which will be presented in a later part of the analysis.
Table 4 shows the top 10 egg-importing countries in 2011 and 2021, and Figure 6 shows their share in global import volumes in the respective years. A comparison of the composition and ranking of the countries reveals some notable changes. Iraq, Switzerland and the United Kingdom have been replaced by the United Arab Emirates, Mexico and Russia. While Iraq still ranked second behind the Netherlands in 2011, it was no longer part of the top group in 2021. This is mainly due to the withdrawal of US troops from Iraq from 2020 on.
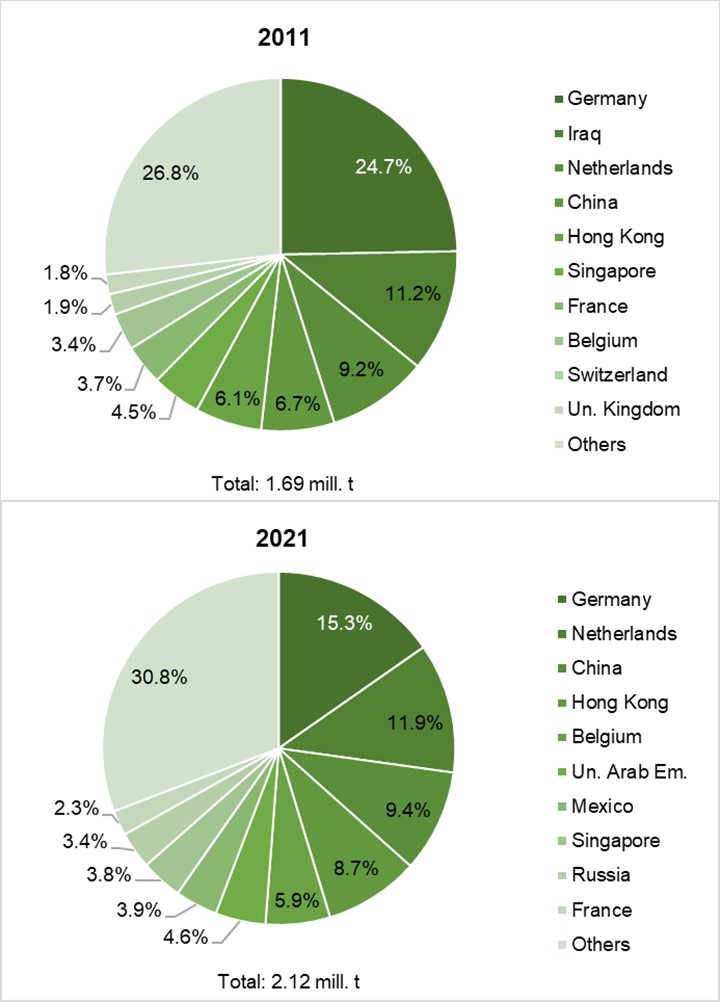
The United Arab Emirates increased its egg imports significantly but re-exported some of its imports to other countries on the Arabian Peninsula (Bahrain, Kuwait, Oman). Mexico had to import more eggs due to a growing population, consistently high per capita consumption and the impact of avian influenza outbreaks. Russia increased its egg imports because of the decline in pig meat production caused by severe outbreaks of African Swine Fever. The change in import volumes is reflected in the countries’ changing contribution to world egg exports.
At first glance, it is surprising that the Netherlands is the second most important egg-importing country, despite its top position in egg exports. This is due to the movement of eggs from east German layer farms owned by Dutch companies to the Netherlands. These eggs were classified as exports from Germany and imports from the Netherlands. Germany reduced its imports by 91,000 tonnes in the reporting year, resulting in a 9.4% decrease in its share of the global import volumes. A considerable increase in the laying hen population allowed for lower imports despite rising per capita consumption.
Patterns of trade flows
In this part of the analysis, the trade flows for leading egg exporting and importing countries are analysed in detail. This will make it possible to identify the driving factors behind the different patterns.
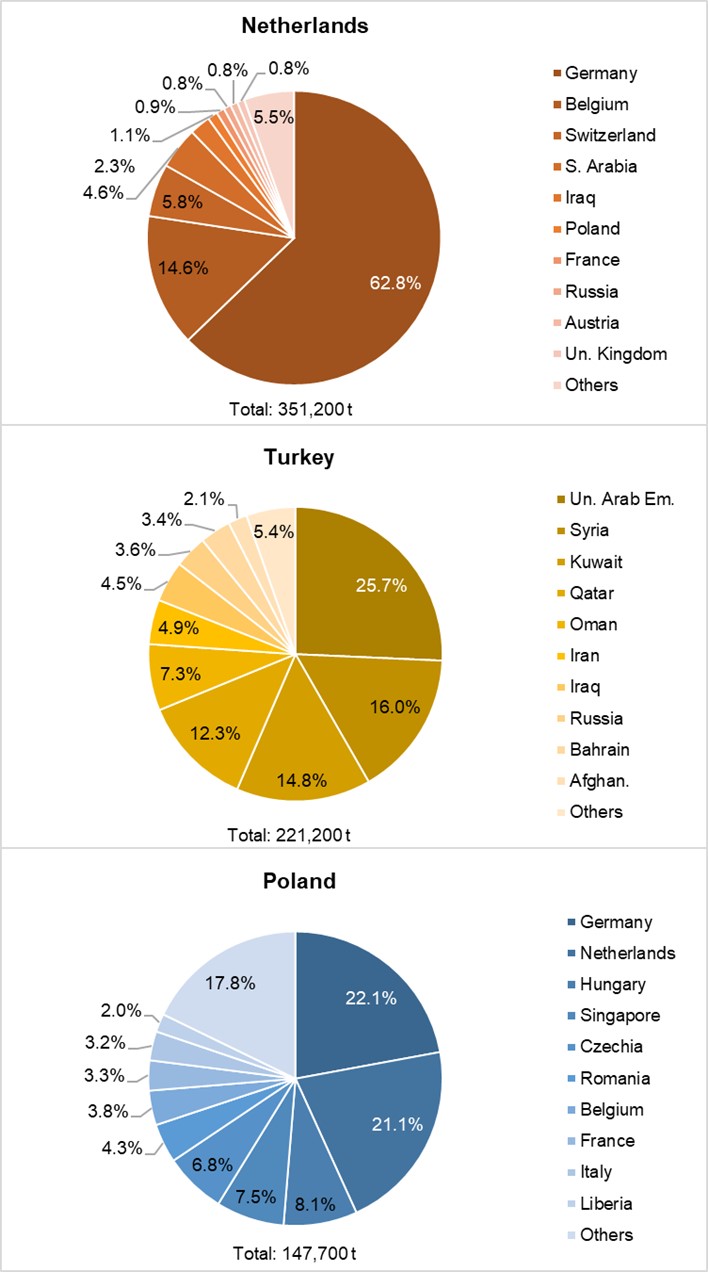
Figure 7 shows the trade flows for egg exports from the Netherlands, Turkey and Poland. In 2021, the Netherlands exported 351,200 tonnes of shell eggs, of which 62.8% went to Germany. A closer look at the composition of the top 10 destinations shows that the EU (27) member states dominated. Obviously, in addition to the absence of customs duties, short transport distances played an important role. Saudi Arabia, Iraq and Russia became attractive markets only a few years ago.
The trade flow pattern of egg exports from Turkey was very different. The regional concentration was almost identical to that of the Netherlands, but there was no dominant country of destination. Of the top 10 countries, 9 were Islamic countries, 5 of which on the Arabian Peninsula. In addition to the Islamic denomination, short transport distances were an important steering factor. The countries of the Arabian Peninsula were accessible by lorry.
Poland exported almost 148,000 tonnes of shell eggs in 2021, of which 82.1% were imported by the EU (27) member states. A closer look at the composition of the countries shows that distance, tariff regulations and Poland’s former membership of COMECON (Council for Mutual Economic Assistance) were the main steering factors in the trade flow pattern.
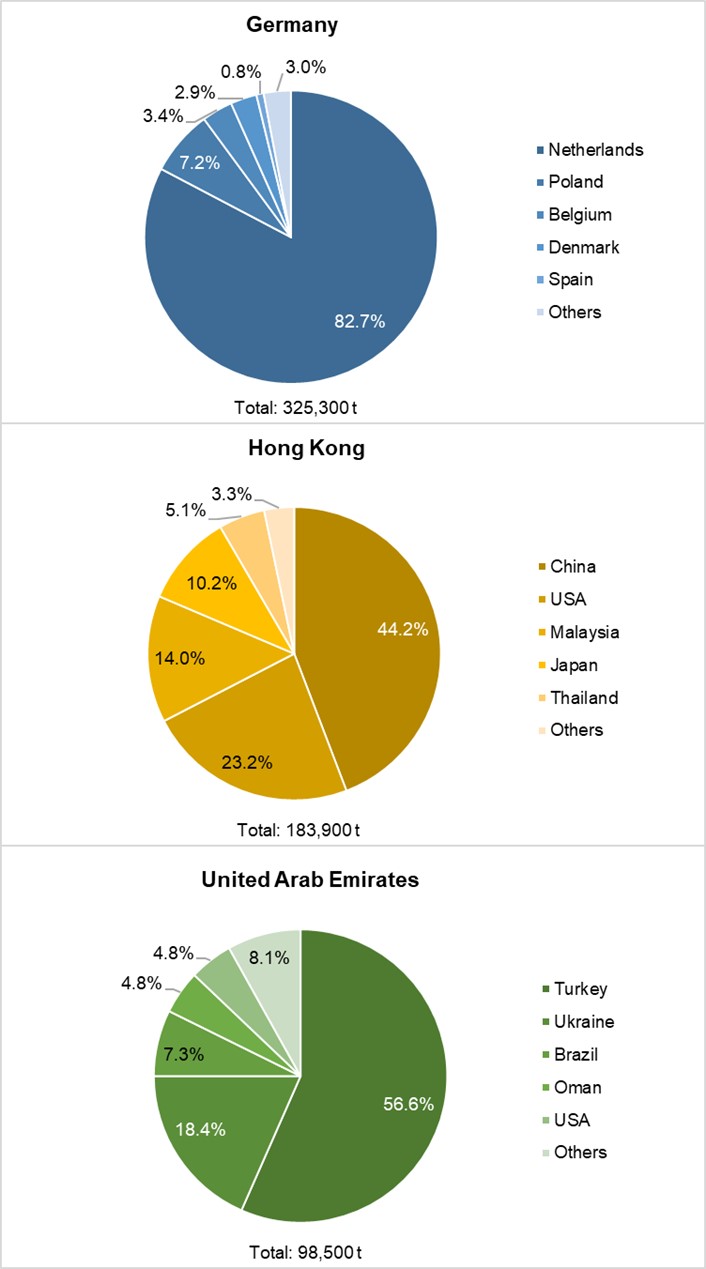
Figure 8 shows the trade flows of egg imports by Germany, Hong Kong and the United Arab Emirates. In 2021, Germany imported more than 325,000 tonnes of shell eggs. Of the import volume, 82.7% came from the Netherlands, reflecting the long-standing trade relationship between the 2 countries. The top 5 countries of origin, all EU (27) member states, accounted for 97% of total imports.
The regional concentration of Hong Kong’s egg imports was also very high. China was the leading country of origin with a share of 44.2%. Of the top 5 countries of origin, 4 were in Asia. Imports from Malaysia, Japan and Thailand showed high growth rates between 2019 and 2021. Egg imports from the USA have fluctuated considerably in recent years. The severe avian influenza outbreaks in 2015 led to a sharp drop in the volume of imports, which only returned to previous levels in 2018. The avian influenza epidemic in 2022 may have caused a further drop.
The UAE imported 98,500 tonnes of shell eggs in 2021, of which 75% came from Turkey and Ukraine, with Turkey being the undisputed leader with a 56.6% share. At first sight, it is surprising that Brazil and the US are among the top countries of origin. Apparently, the close trade relations in chicken meat imports allowed both countries to export shell eggs as well. In 2022, the war in Ukraine will have significantly reduced the volume of exports.
Considering the trade flow patterns in context, it is clear that transport distances, tariff regulations, religious denominations and political tensions or close relations were important steering factors for the respective patterns.
*References available upon request.
Join 31,000+ subscribers
Subscribe to our newsletter to stay updated about all the need-to-know content in the poultry sector, three times a week.


 Beheer
 WP Admin
  Bewerk bericht